
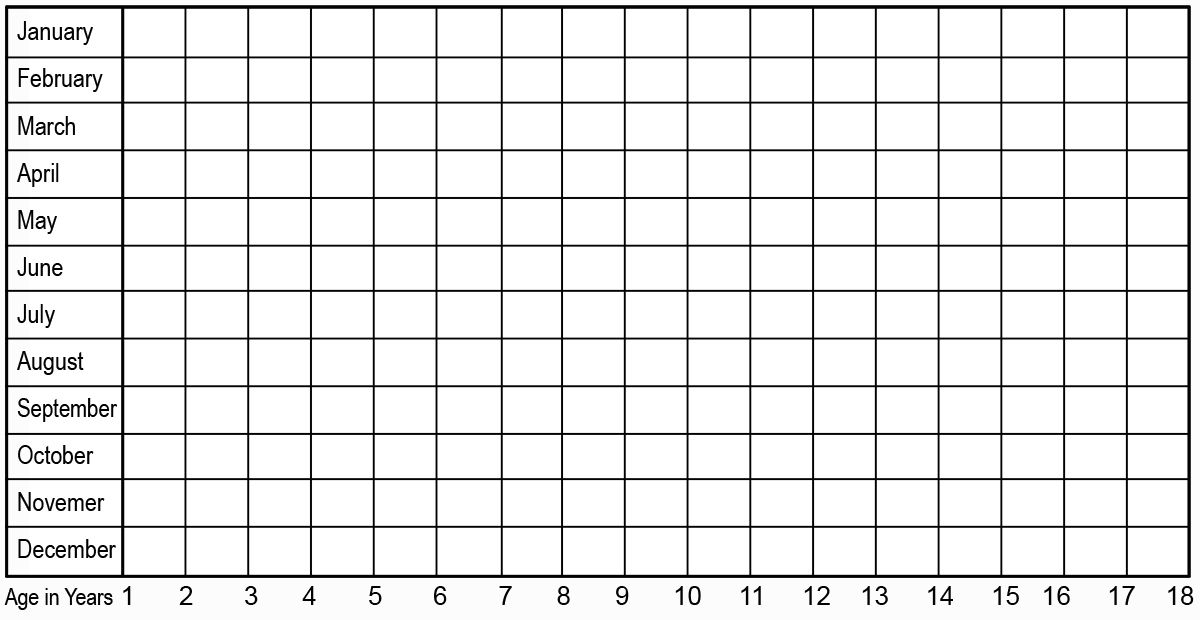
Cycles of Mobility Chart
Instructions: Make a time chart of the separation patterns for the first eighteen years of the ATCK’s life, using different colors to fill in the spaces for when and where he or she lived.
For example:
Blue = time living with parents in the home country
Green = time living with parents in the host country #1
Purple = time living with parents in the host country #2
Yellow = time living with parents in the host country #3
Brown = time spent away from parents in boarding school in the host country
Pink = time spent away from parents in boarding school in the home country
Orange = time living with anyone other than parents or boarding school
Download Cycles of Mobility Chart here (right-click on image or link to Save As)
May be printed for personal or group use.